Need a 5-day Data Analysis lesson plan?
If you love GOW, but would like students to dive deeper into one topic (through synthesizing several pieces of data), this 5-Day GOW is perfect for you and your students.
I initially started these 5-Day GOWs when the COVID-19 pandemic hit in mid-March 2020, resulting in school closures. The topics centered mostly around how the Coronavirus was affecting us and our students' lives. I thought it was also a fantastic way for students to record their experience of this historic event through their reflections of this data. It also helped me understand and get to know my students at a more personal level.
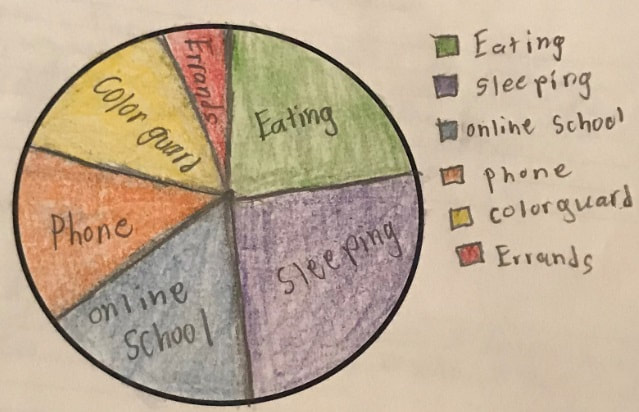
Students will be reflecting and analyzing several graphs in a 5-Day GOW.
Please note: I do not own the graphs. In order for your students to see the graphs they are writing about, refer them to graph links below, or you can access them yourself and post them to your webpage. If you have any questions, please feel free to email me.
If you love GOW, but would like students to dive deeper into one topic (through synthesizing several pieces of data), this 5-Day GOW is perfect for you and your students.
I initially started these 5-Day GOWs when the COVID-19 pandemic hit in mid-March 2020, resulting in school closures. The topics centered mostly around how the Coronavirus was affecting us and our students' lives. I thought it was also a fantastic way for students to record their experience of this historic event through their reflections of this data. It also helped me understand and get to know my students at a more personal level.
Students will be reflecting and analyzing several graphs in a 5-Day GOW.
Please note: I do not own the graphs. In order for your students to see the graphs they are writing about, refer them to graph links below, or you can access them yourself and post them to your webpage. If you have any questions, please feel free to email me.